Brain Evoked Potential Study
Posted at 00:31h in Services by doctor
Evoked potential is an electrical signal with which nerve cells respond to an external stimulus or to perform a mental task.
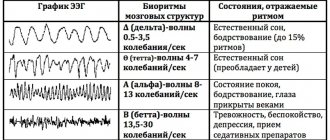
In 1929, HansBerger from Germany drew attention to the bioelectrical activity of the brain: when an electrical impulse is transmitted from one neuron to another, weak electrical waves arise, and an electroencephalograph device can record them.
The electroencephalogram reflects the general bioelectrical activity of brain activity. It was impossible to isolate from it the reaction to external stimulation of any individual visual or auditory analyzer at that time, since the biofield of the evoked potential (from 0.5 to 15 μV) is tens and hundreds of times weaker than the general activity of the brain (20 - 50 μV).
Only in the middle of the twentieth century did a device appear that made it possible to isolate weak amplitudes of evoked potential oscillations from the total amplitude of brain activity. This occurs using the summation method: stimulation that stimulates the potential being studied is repeated from 100 to 1000 times at precise time intervals.
The computer summarizes only those segments of the encephalogram (EEG) that immediately follow the sensory stimulation. If the total amplitude during this time can increase and decrease, take on positive and negative values and in total tend to zero, then the evoked potential has the same response form and accumulates depending on the number of stimuli given.
The more stimulating external influences, the lower the “noise level” of the overall activity. An evoked potential with a high intrinsic amplitude is isolated quite cleanly with the help of 50–60 repetitions, and a weak response to a stimulus requires more than 500 repetitions for its isolation.
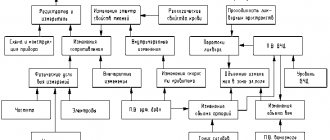
- stimulus generator - a device made from electrodes on the head;
- bioelectric impulse amplifier
- analog-to-digital converter;
- computer for data processing;
- printer for printing.
Properties of evoked potentials
Necessary concepts for deciphering and interpreting the results:
- Latency is the time from the beginning of stimulation to the maximum value of the response impulse. Short-latency EPs (less than 0.050 sec); medium-latency (0.050 – 0.1 sec.); long-latency (longer than 0.1 sec.).
- Oscillation amplitude is the range of oscillation from maximum to minimum value.
- Polarity . To the same irritation, symmetrical parts of the brain can respond in diametrically opposite ways.
- Aftercharge is the decay time of the response pulse. It occurs 0.3 seconds after the stimulus is given and lasts from 0.5 seconds to 1 second).
Sensory evoked potentials are divided into visual, brainstem auditory, somatosensory, and motor. Studies of each of them make it possible to diagnose a variety of diseases of the nervous system.
Reaction of the organs of vision
Visual evoked potentials are bioelectrical impulses from the brain in response to irritation of the visual organs. They examine vision all the way from the retina to the centers in the cerebral cortex located in the occipital part, and can determine the location and nature of its damage.
Visually evoked potentials (VEPs) use the visual analyzer to assess the functioning of the nervous system. They assume that the patient is able to focus his vision and keep his gaze at one point.
If the patient has an injury to the eye, optic nerve, or impaired thinking abilities, the VEP method is not recommended. In most cases, stimulation is given to one eye using LED glasses.
- Reaction to a flash of light . The study is carried out for patients who cannot fix their gaze or have difficulty seeing at all; The method is used for early diagnosis of visual impairment in newborns. Flashes are stimulated using a matrix in LED glasses; they are presented monocularly. The patient is in a room isolated from light and sound, his eyes are closed. Working electrodes are connected to the occipital region; reference electrodes are usually ear or frontal. To obtain a satisfactory picture of evoked potentials, it is sufficient to carry out from 50 to 100 stimulations. The response to an external stimulus will be a series of oscillations - positive and negative - with the same latency.
- Reaction to a change in chess pattern . The subjects observe a frequent change of cells - black and white. Large cells stimulate peripheral vision, small cells mobilize central vision. To isolate evoked potentials, it is necessary to make 100–200 external stimuli.
Interpretation of results
The following values are taken for analysis: N75; P10; N145. The index N means the lowest level (peak) of the pulse; P is the highest. Numbers 75, 100,
145 means the latency (duration) of each peak.
- increased latency (due to impaired speed of impulses passing through the optic nerves;
- violation of symmetry, when readings from the right and left eyes differ (due to damage to the cerebral cortex);
- change in amplitude, both upward and downward. The P100 indicator is especially important for correct diagnosis.
Nomenclature and classification
Schematic representation of a transient auditory evoked response.
The symbols above the waves represent standard electrophysiological nomenclature. The P3 or P300 component represents the event-related potential 300 ms after stimulation.
In the ERP studies of the first years, the analyzed components were defined as positive or negative peaks observed either in the evoked responses themselves or in the difference ERPs. Difference evoked potentials were obtained by subtracting the evoked response recorded in a task that did not require the involvement of certain psychological operations from the ERP in another task where these operations were supposed to occur. The potential deviations seen on difference evoked responses can be divided into different classes depending on their latency and polarity (positive or negative), as for example: P100, N100, N200, P200, P30, N400, where P is used to indicate positivity , and N is the negativity, and the number denotes the latency period (LP) of the peak in milliseconds. However, peak latency is not an exhaustive characteristic of the components of evoked potentials. In particular, the peak latency of the so-called RDb component, depending on the complexity of the target/non-target stimulus discrimination task, can vary within several hundred milliseconds. Even the polarity of a particular component may depend on the conditions under which evoked responses are recorded. Thus, the C1 component, which is generated in area VI of the visual cortex, is negative for stimuli presented in the upper part of the visual field, and positive for stimuli from its lower area. The reason for this is the special anatomical spatial organization of the 17th Brodmann area (BA) of the cerebral cortex.
Another approach to the classification of evoked potentials involves considering components from the standpoint of their functional significance. There are several components of EP that are recorded only in certain behavioral paradigms and bear special labels in accordance with their intended function. Some of the most studied EP components are: “mismatch negativity” (HP) as an indicator of detection of changes in repeated auditory stimulation; “process negativity” (PN) as an indicator of focusing attention on one of the sensory channels; “error negativity” (EO) as an indicator of incorrect, erroneous actions in the long-term execution of a test task; N2 NOGO component as an indicator of suppression of the motor response, P3b components as an indicator of updating working memory; Р3а-components as an indicator of involuntary switching of attention.
Visual evoked potentials
Normal visual evoked potentials with two positive peaks at 100 (here 109 ms after stimulation) and 200 ms
Visual evoked potential (VEP) are electrical signals generated by the visual cortex in response to visual stimulation. They are caused by flashes of light or a specific pattern, such as a checkerboard, and are recorded from the occipital electrodes. Used to confirm damage to the visual pathway,5 including the retina, optic nerve, optic chiasm, optic radiation, and occipital cortex.6 One application is to measure visual acuity in children. Electrodes are placed on the infant's head above the visual cortex, and a checkerboard or grid pattern is alternately displayed on a gray background. If the controller fields or bars are large enough to be detected, visual evoked potentials are generated; otherwise nothing is generated. This is an objective way to measure a child's visual acuity.7
Visual evoked potential is most sensitive to visual disturbances that cannot be detected by physical examination or MRI alone, even if the etiology cannot be determined. Visual evoked potentials can be pathological with: optic neuritis; optic neuropathy; demyelinating disease; multiple sclerosis; Friedreich's ataxia; vitamin B12 deficiency; neurosyphilis; migraine; ischemic disease; tumor compressing the optic nerve, ocular hypertension; glaucoma; diabetes; toxic amblyopia; aluminum neurotoxicity; manganese intoxication; retrobulbar neuritis and traumatic brain injury.8
The P100 component of the visual evoked potential response is of great clinical importance. For example, patients with acute severe optic neuritis often lose the P100 response or have severely diminished responses. Clinical recovery and visual improvement come with restoration of P100, but with an abnormally increased latency that continues indefinitely, and may therefore be useful as an indicator of previous or subclinical optic neuritis.9
Visual evoked potentials in a patient with multiple sclerosis with optic neuritis.
VEPs are recorded using an electrode located in the middle occipital (Oz) region, relative to the middle frontal (Fz) canal. (A) The normal response results in a sequence of three major negative (N)-positive (P)-negative (N) components that peak at approximately 75–100–145 ms, with a topographic distribution in the occipital and midline. All components are formed in the striated cortex. VEPs are interpreted in terms of differences in the latency, amplitude and intervertebral effect of the P100 component, which is the most stable component obtained after stimulation with changes in structure. (B) Abnormal P100 in a 26-year-old female patient diagnosed with acute left optic neuritis and sensory disturbances as initial symptoms.
Types of visual evoked potentials
Some specific VEPs:
- Monocular pattern reversal (most common)
- Sweep visual evoked potential
- Binocular visual evoked potential
- Chromatic visual evoked potential
- Hemi-field visual evoked potential
- Flash visual evoked potential
- LED Goggle VEP
- Motion visually evoked potential
- Multifocal visual evoked potential
- Multi-channel visual evoked potential
- Multi-frequency visual evoked potential
- Stereo-elicited visual evoked potential
- Steady state visually evoked potential
Auditory evoked potentials
Auditory Evoked Potentials
Auditory evoked potentials (AEPs) can be used to track the signal generated by sound along the ascending auditory pathway. The evoked potential is generated in the cochlea, passes through the cochlear nerve, through the cochlear nucleus, superior olivary complex, lateral lemniscus, to the inferior colliculus in the midbrain, to the median geniculate body and finally to the cerebral cortex.10 The auditory evoked potential is a very small electrical voltage potentials originating from the brain that are recorded on the scalp in response to an auditory stimulus such as various tones, speech sounds, etc. that are recorded in response to an auditory stimulus from electrodes placed on the scalp.
Auditory evoked potentials were divided into short latency components, with latency <10 ms in adults; SVP with high latency exceeding 50 ms; and SVP with average delay.
Auditory evoked potentials are used to assess the functioning of the auditory system and neuroplasticity.11 They can be used to diagnose hearing impairment in children, and hearing thresholds can be assessed, which helps in the development of special educational programs for people with hearing or cognitive problems.12
Somatosensory evoked potentials
Somatosensory evoked potentials (SSEPs) are EPs recorded in the brain or spinal cord during repeated stimulation of peripheral nerves. Somatosensory evoked potentials are used in neuromonitoring to assess a patient's spinal cord function during surgery. They are recorded by stimulating most often the tibial nerve, median nerve or ulnar nerve, usually with an electrical stimulus. The response is then recorded from the patient's scalp.
Left side: Normal short-latency somatosensory evoked potentials (SSEPS) after stimulation of the median nerve (top photo) and posterior tibial nerve (bottom photo). Right side: top image shows normal median nerve SSEPS, while scalp potentials from the posterior tibial nerve (bottom image) show scattered P37 potential with long latency
Electrical stimuli are still the most common for conducting somatosensory evoked potentials due to ease of execution and reliability. 13 SSEP can be used to predict the condition of patients with severe traumatic brain injury. 14 Because somatosensory evoked potentials with a latency of less than 50 ms are relatively independent from consciousness, when used early in a comatose patient, it can reliably and effectively predict the outcome.15 For example, comatose patients without a bilateral reaction do not recover from coma in 95% of cases.16 But one must be careful when analyzing the result. For example, increased sedation and other CNS damage can affect somatosensory evoked potentials.
Because of the low amplitude of the signal once it reaches the patient's scalp and the relatively high level of electrical noise caused by background EEG, scalp muscle EMG, or electrical devices in the room, the signal must be averaged. Using averaging improves the signal-to-noise ratio. Typically, in the operating room, greater than 100 and up to 1000 average values must be used to adequately resolve the evoked potential.
The two most studied aspects of SSEPs are peak amplitude and latency. The most predominant peaks were studied and named in the laboratories. Each vertex is assigned a letter and a number in its name. For example, N20 refers to the negative peak (N) at 20 ms. This peak is recorded in the cerebral cortex when the median nerve is stimulated. This most likely corresponds to a signal reaching the somatosensory cortex. When used in intraoperative monitoring, peak latency and amplitude relative to the patient's baseline after intubation are important indicators. A sharp increase in latency or decrease in amplitude are indicators of neurological dysfunction.
During surgery, the large amount of anesthetic gases used can affect the amplitude and latency of SSEPs. Any of the halogenated agents or nitrous oxide will increase the latency and decrease the amplitudes of the responses, sometimes to the point that no response is detected. For this reason, an anesthetic containing less halogenated agent and more intravenous hypnotics and narcotics is usually used.
Laser evoked potentials
Conventional SSEPs control the functioning of part of the somatosensory system associated with sensations such as touch and vibration. The portion of the somatosensory system that transmits pain and temperature signals is controlled by laser-evoked potentials (LEPs). Laser-evoked potentials are used to detect conduction disturbances through the spinothalamic tracts. Potentials are evoked by an infrared laser stimulus. The radiation is aimed at creating painful thermal irritation on the skin of the hand and foot. In the peripheral nervous system, pain and heat signals are transmitted along thin (C and A-delta) fibers to the spinal cord and then to the thalamus and cerebral cortex. HDL can be used to determine whether there is damage in the spinothalamic tract, or neuropathy in these small sensory fibers, or in larger (touch, vibration) fibers.17
Motor evoked potential
Monitoring results of transcranial electrical evoked potentials from the first dorsal interosseous (FDI) and anterior tibialis (ATib) muscles
Motor evoked potentials (MEPs) are recorded by muscles after direct stimulation of the exposed motor cortex or transcranial stimulation of the motor cortex, magnetic or electrical. Transcranial magnetic MEP (TCmMEP) has high clinical and diagnostic potential. Transcranial electrical MEP (TCeMEP) has been widely used for several years to intraoperatively monitor the functional integrity of the pyramidal tract.
During the 1990s, attempts were made to monitor "motor evoked potentials", including "neurogenic motor evoked potentials" recorded by peripheral nerves, following direct electrical stimulation of the spinal cord. It became clear that these "motor" potentials were almost entirely caused by antidromic stimulation of sensory pathways - even when recording was from muscles (antidromic stimulation of sensory pathways triggers myogenic responses through synapses at the root element level). TCMEP, whether electrical or magnetic, is the most practical way to provide purely motor responses, since stimulation of the sensory cortex cannot result in descending impulses beyond the first synapse (synapses cannot return impulses).
MEP-induced transcranial magnetic stimulation (TMS) has been used in many cognitive neuroscience experiments. Because MEP amplitude correlates with motor excitability, they offer a quantitative way to test the role of different types of interventions in the motor system (pharmacological, behavioral, lesion, etc.). Thus, transcranial electrical stimulation induced by MEPs may serve as an indicator of latent motor preparation or facilitation, such as that induced by the mirror neuron system when observing another's actions.18 In addition, MEPs are used as a reference for adjusting the intensity of stimulation to be delivered by TMS when targeting to cortical areas whose response may not be as easily measurable, for example in the context of transcranial magnetic stimulation based therapy.
Brainstem evoked potentials to acoustic stimulation
Auditory evoked potentials are the response of the auditory nerve and parts of the brain (its stem part) to auditory stimuli.
The most common in medical practice are short-latency acoustic stimulation evoked potentials (ASEPs).
The sound signal along its path passes through 5 “stations” - departments of the central nervous system. Each of these centers responds to stimulation with an amplitude of bioelectric field oscillations with positive (P) and negative (N) peaks.
Amplitude bursts are produced by nerve centers in the following order: I. auditory nerve → II. cochlear nucleus →III. olive →IV. lateral lemniscus → V. inferior colliculus and cerebral cortex.
The signal transmission path of the auditory analyzer passes through the brain stem, which is associated with the vital functions of the body and its cognitive capabilities. Therefore, KASVP is used in assessing the condition of seriously ill patients in a coma, as well as in assessing a person’s intellectual activity.
The CASVP technique consists of using stimulation with short clicks, first on one ear, then on the other. Sound duration is 0.1 milliseconds, frequency is 10 clicks per second.
To record the evoked potential, the active electrode is placed on the crown, the control electrode is placed on the earlobe that receives the stimulus, and the ground electrode is placed on the opposite ear.
To accurately deduce CASVP from the general EEG background, the number of stimulating signals should be about 3000 with double averaging. The result is a graph of a wave function with five positive and negative peaks.
Interpretation of results
The absence of waves or the presence of only one amplitude instead of five indicates depression of vital centers and gives a poor prognosis for future life.
- the interval between I, II and III peaks is increased;
- amplitude III became smaller;
- waves of II, IV, V centers have changed.
Recent studies have established that component III of the evoked potential graph of the auditory analyzer - P300 (P is the designation of the positive peak, 300 is the latent period) is associated with cognitive evoked potentials.
A decrease in the amplitude of P300 and an extension of its latent period may indicate diseases of the intellectual sphere: schizophrenia, dementia, autism, parkinsonism, Alzheimer's disease.
Analysis of auditory evoked potentials is indispensable when searching for the causes of speech and hearing disorders in children, because make it possible to determine at what stage of sound signal transmission the failure occurs: either it is a peripheral disorder or a lesion of the central nervous system.
Why is this important?
The otolith organs are located in the inner ear on the left and right. They are amplifiers of the gravity information that enters the brain. Based on this information, a person can maintain a vertical body position, automatically regulate muscle tone, and navigate in space. These abilities are the foundation for all types of cognitive activity. The otolith organs also respond to linear acceleration and vibration. Many children have hidden disorders of otolithic function.
The functions of the otolithic apparatus can be developed with the help of special exercises. VMVP allows you to assess the dynamics of changes.