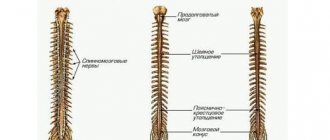
The biophysical manifestation of the functioning of the nervous system is spontaneous electrical activity. Thanks to the processes of generating electrical impulses, their suppression, and transmission, nerve cells are united into a single system that controls the body. This electrical activity can be recorded in the nervous system at any level.
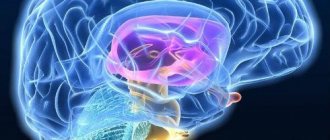
Electroencephalography is a branch of electrophysiology of the central nervous system (CNS), which studies the patterns of distribution of electrical activity in the brain to determine the functional state of the brain. Currently, this technique has found very wide application in neurology, neurosurgery, psychiatry, endocrinology and is leading in the study of the function of the central nervous system. The technique is based on recording electrical activity, which is the basis for the functioning of any excitable tissue of the body.
Electroencephalography allows:
- Differentiate a diffuse pathological process (vascular, inflammatory) from a focal lesion (tumor, hematoma, abscess).
- Determine the affected side based on the presence of interhemispheric asymmetry.
- Localize the primary focus in one of the hemispheres.
- Establishing the degree of severity and nature of cerebral disorders.
- Identification of the epileptogenic cortical focus and the nature of cerebral changes associated with it.
- To identify the nature of the general reactivity of the cerebral cortex by studying EEG changes during various functional tests.
- Evaluate the therapeutic effect of certain medications.
- Determine the dynamics of the process by comparative analysis of data recorded at different times.
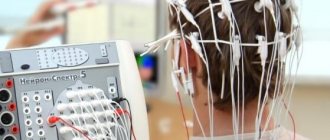
An electroencephalogram (EEG) is a waveform obtained by recording the electrical activity of the brain through the tissues of the skull. Registration of potentials directly from the cerebral cortex is called an electrocorticogram.
Electrical activity in the cerebral cortex was discovered by physiologists back in the middle of the last century (1849), when electrical negativity was discovered at the site of the section of the brain of a frog and turtle. Then, for a long time, no one studied the electrical activity of the brain. Only in 1875 - 1876 did they resume the study of animal brain potentials under various stimuli (V. Ya. Danilevsky, Caton). In 1884, N. E. Vvedensky used a telephone to listen to electrical processes in muscles and nerves, and later in nerve centers. Subsequently, the study of the electrophysiology of the brain was carried out using galvanometers, which, due to their inertness, made it possible to observe changes in the constant potential under various stimuli, i.e., slow oscillations in the cortex were recorded. Fast rhythms were detected with significant distortion.
The beginning of clinical EEG is considered to be 1924, when Hans Berger first recorded EEG signals in humans. At the same time, his works gave a description of the basic rhythms. In 1936, G. Walter, while studying patients with brain tumors, discovered that changes in rhythms could have diagnostic value. In the EEG of patients, he found slow waves, which he called Delta waves. In the USA, in the mid-30s, Devis, Jasper and Gibbs discovered specific EEG manifestations in patients with petit mal seizures.
Subsequently, EEG developed in two ways: improvement of the technical base, with the creation of new, more sensitive and accurate instruments; study of EEG phenomenology and improvement of diagnostics. But encephalographers were constantly faced with the question of the localization and mechanism of impulse generation. Significant advances have been made in this direction, especially since the beginning of the study of the neurophysiology of individual neurons. This was important for understanding the nature of EEG.
It has now been established that the central nervous system at all its levels generates spontaneous electrical activity. This rhythm is complex, especially in the cerebral cortex; it depends on the functional organization and changes under the influence of various stimuli.
There are many theories to explain the nature of these rhythmic processes, based on the study of the electrical activity of individual neurons and synoptic potentials. It has been established that neurons, even those located close to each other, have different activities. But if we assume that the neurons all work independently of each other, then how does the rhythmic activity observed on the EEG come from this noise curve? The presence of rhythms in the EEG is now considered a direct indicator that the neurons of the brain synchronize their activity in a complex way, which allows the system to function as a single whole. Those. neurons work in a single dynamic relationship, and changes in relationships at different levels of organization, inter-level relationships will lead to changes in rhythmic activity, which will be a direct reflection of changes in the functional state.
Equipment
To record EEG, devices called Electroencephalographs are used. They consist of an electrode part, an amplifier system, and a recording device. Electrodes come in different types: cup and bridge. They are made from electrically conductive carbon or metal with a silver chloride coating. Such a coating is necessary so that a constant potential does not accumulate on the electrode, which causes polarization of the electrode. This results in interference. Non-metallic electrodes are least polarized.
To ensure accurate registration, parallel common-mode amplifiers with a notch filter are used. This allows you to combat network interference. In terms of their quality, amplifiers now allow recording without an electrically insulated chamber and without grounding.
Recording device. Initially, writing instruments with a paper tape feed were used as a recorder. They differed in ink devices and devices with a thermal pen. But consumables were quite expensive. Nowadays computer technology is used as a recording device. With the advent of computer technology, it became possible not only to record EEG on a non-paper medium, but also to carry out additional mathematical processing of EEG. This increased the resolution of the method.
The application of electrodes is also carried out in various ways. The international system adopted as the standard is the 10 - 20 system. Electrodes are applied as follows. Measure the distance along the sagittal line from Inion to Nasion and take it as 100%. At 10% of this distance from Inion and Nasion, the lower frontal and occipital electrodes are installed, respectively. The rest are placed at an equal distance of 20% of the distance inion - nasion. The second main line runs between the ear canals through the crown.
The lower temporal electrodes are located at 10% of this distance above the auditory canals, and the remaining electrodes of this line are located at a distance of 20% of the length of the biauricular line. The letter symbols indicate, respectively, areas of the brain and landmarks on the head: O - occipitalis, F - frontalis, A - auricularis, P - parietalis, C - centralis, T - temporalis. Odd numbers correspond to the electrodes of the left hemisphere, even numbers - to the right.
According to Young's system, frontal electrodes (Fd, Fs) are located in the upper part of the forehead at a distance of 3 - 4 cm from the midline, occipital electrodes (Od, Os) - 3 cm above the inion and 3 - 4 cm from the midline. The segments of the lines Od - Fd and Os - Fs are divided into three equal parts and central (Cd, Cs) and parietal (Pd, Ps) electrodes are installed at the division points. At the horizontal level of the upper edge of the auricle, the anterior temporal (Tad, Tas) are installed along the frontal line Cd - Cs, and the posterior temporal (Tpd, Tps) are installed along the frontal line Ps - Pd.
The advantage of the 10 - 20 system is a large number of electrodes (from 16 to 19 - 24), but this system requires more sensitive equipment, because the interelectrode distance is small and the potential is weak. Young's system provides sufficient distance and all electrodes are evenly distributed over the surface of the head, but the degree of localization during abduction is insufficient.
The method of removing potential can also be different. The generally accepted system is monopolar recording. In this case, the electrodes on the head are active and record changes in potential relative to an indifferent electrode (most often located on the earlobes). Bipolar recording detects the change in potential between two electrodes located at different points on the surface of the scalp.
All the indicated methods and techniques have their advantages and disadvantages. Therefore, in international practice, mandatory recording according to the 10-20 system is established, both in monopolar and bipolar modes. During computer recording, registration using the 10-20 system is allowed with further digital conversion of the EEG according to the selected bipolar scheme.
Daytime and 24-hour EEG monitoring
The results of EEG video monitoring during sleep are key to establishing the correct diagnosis, since activity in the first and second phases of sleep provides the greatest amount of information. Night research is not able to establish the cause of the attack and its mechanism of development. This is recorded during daytime EEG monitoring.
The patient prepares for the daytime study in the same way as for nighttime EEG monitoring. With proper preparation, children fall asleep quite quickly. It is more difficult for adult patients to fall asleep, people with severe sleep disorders, anxiety, subdepressive or depressive symptoms, and circadian rhythm disorders. In this case, neurologists recommend complete sleep deprivation - the patient does not sleep throughout the night on the eve of EEG monitoring.
Immediately before starting the study, you should walk outside for 1-2 hours. In some cases, the attending physician discontinues antiepileptic drugs one day before EEG monitoring. This increases the likelihood of detecting epileptiform activity. Patients who suffer from arterial hypertension, diabetes mellitus, and bronchial asthma are advised to take medications that they take regularly, since complete sleep deprivation can cause exacerbation of chronic diseases.
The duration of daytime video EEG monitoring is 4 hours. The study makes it possible to monitor the effectiveness of treatment and analyze the biological activity of the brain during daytime sleep.
Parameters of normal alpha rhythm
The frequency is 8-13 Hz, according to some authors the frequency is 7-12 Hz or 8-12 Hz. Most often, in a normal state, a frequency of 9-10 Hz is found, which can be called a normorhythm. Then the average frequency of 8-9 (7-9) Hz can be considered a slow alpha rhythm, and 11-12 Hz - a rapid one. Naturally slow and rapid rhythms are already beyond the norm (in adults) and can be considered as conditionally pathological (according to O. M. Grindel)
normal amplitude Some authors recognize 20-110 µV as the norm. The amplitude normally varies depending on age.
Zonal distribution - normally determined by the occipital-parietal zone, where the rhythm is most pronounced. This position is recognized by everyone equally.
Modulation is characterized by a wave-like change in the amplitude of the rhythm.
Sinusoidality sets the normal roundness of the vertices. With computer visualization, the sinusoidality is not detected so clearly (with 8-bit recording) and all rhythms seem sharpened. But, as a rule, a true sharpening of the rhythm must be combined with other disturbances of the normal rhythm.
Symmetrical in amplitude and frequency. The reliability of amplitude symmetry is established by good application of electrodes with impedance measurement. Frequency asymmetry must also be objectified (reliability criteria). In this case, it is necessary to take into account the presence of physiological asymmetry of the hemispheres.
The reaction of activation of the alpha rhythm, i.e. its suppression when opening the eyes or a flash of light. This phenomenon is one of the main characteristics of the alpha rhythm. According to it, the detected rhythm can be accurately attributed to the alpha rhythm.
Alpha rhythm index , which is normally 80%. During mathematical processing, the index can be calculated as a percentage of the power of the alpha rhythm relative to the power of other rhythms in the occipital and parietal leads.
Preparation
Night video EEG monitoring in Moscow is performed by neurophysiologists. Doctors recommend waking up the child 1.5-2 hours earlier than the usual wake-up time on the day of the study. During the day, the baby does not need to be put to bed. You need to play active games with him.
On the eve of the study, parents begin preparing the child from 18.00:
- Limit the amount of liquid, sweet, spicy and salty foods you drink;
- Play quiet, calm games with the baby;
- Walk in the fresh air in a quiet place, where there are no stimulating factors or other children;
- Avoid watching television, computer or video games.
For overnight monitoring, it is usually necessary to arrive at the neurology clinic in the evening. The time is pre-agreed with a functional diagnostics doctor. Depending on when the child usually falls asleep, the preparatory work begins. It includes his adaptation to the new place and the actual preparation for the procedure.
Parameters of normal beta rhythm
Frequency 12-25 Hz (some recognize 13-25 Hz) Beta1 rhythm 25Hz Beta2 rhythm -40Hz
The amplitude is small - 10-15 µV.
Zoning - normally distributed in the anterior-central and temporal regions. According to Zhirmunskaya E.A. The beta 1 rhythm is not purely physiological and is not typical for the norm. Temporal beta rhythm is often the result of muscle artifact.
C-rhythm is a variant of the normal rhythm with a frequency of 8 - 13 Hz and is detected in the central sections. It has the following features: it disappears with the contralateral active clenching of the hand into a fist, it is narrowly localized in the central sections. Slow rhythms that occur normally. Theta rhythm - frequency 4-8 Hz, amplitude up to 30-40 µV. Delta rhythm - frequency 0.5-4 Hz, amplitude up to 30-40 µV.
Decoding the EEG of the brain in children
EEG in children has its own peculiarities. An EEG recording of a premature baby born at 25–28 weeks of gestation looks like a curve in the form of slow flashes of delta and theta rhythms, which are periodically combined with sharp wave peaks of 3–15 seconds in length with a decrease in amplitude to 25 μV. In full-term newborns, these values are divided into 3 types of indicators:
- when awake (with a periodic frequency of 5 Hz and an amplitude of 55–60 Hz);
- in the active phase of sleep (with a stable frequency of 5–7 Hz and a fast, low amplitude);
- during restful sleep with flashes of delta oscillations at high amplitude.
Over the course of 3-6 months of a baby’s life, the number of theta oscillations is constantly growing. The delta rhythm is characterized by a decline. From 7 months to one year, alpha waves are formed in the child, and delta and theta gradually fade away. Over the next 8 years, the slow waves on the EEG are constantly replaced by fast alpha and beta oscillations. Until the age of 15, alpha waves predominate. By the age of 18, the formation of the biological activity of the brain is completed.
In order to undergo an examination and decipher the EEG results, call the Yusupov Hospital. The contact center is open every day around the clock. Neurophysiologists analyze the EEG over time and compare the results of the study with the normal EEG.
Regional EEG features
The dominant rhythm is the rhythm of potentials that predominates in a given section of the curve and, when visually analyzed, is distinguished by the greatest periodicity and regularity, and by frequency analysis, by the greatest amplitude. Occipital, parieto-occipital and temporo-occipital regions . The dominant alpha rhythm is clearly expressed, biphasic, sinusoidal, suppressed upon opening the eyes. The appearance in the posterior parietal and parietal region of a rhythm with a frequency of 20-26 Hz, in a state of rest, can be considered as irritation of the cortex.
Parietal-central and anterior 2/3 of the temporal region . The alpha rhythm predominates, but without clear dominance. In addition to it, the following are recorded: 1) theta rhythm (4-7 Hz), with an amplitude less than the alpha rhythm. When opening the eyes it changes; 2) rolandic (arc-shaped) rhythm (^-rhythm) with a frequency of 8 - 12 Hz, arch-shaped, does not change when the eyes open, and even intensifies. Disappears with contralateral physical activity. 3) Frequent extrarolandic frequency of 16 - 30 Hz, with an amplitude of 10 - 30 μV, does not change with afferent influences ((31-rhythm).
The anterior parts of the hemispheres are the precentral and frontal regions. Frequent rhythms are intensified, alpha is almost not visible. The theta rhythm is reduced compared to the central regions.
That. The background pattern of the EEG is a complex organized wave process consisting of spindles of alpha rhythm modulated to varying degrees, against the background of low-amplitude high-frequency activity such as the beta rhythm. This pattern appears in the posterior regions. In more oral areas, elements of slow-wave activity with a background beta rhythm appear.
Theoretically, the origin of the basic EEG pattern is derived from the biophysical premise that each cell is a small impulse generator. But the central nervous system cannot be perceived as a collection of different centers, which in turn consist of individual, elementary (even if interconnected by processes of excitation and inhibition) impulse generators. The nervous system is a complex, balanced, flexible system, the function of which is determined primarily by morphological and dynamic connections. This is confirmed by the great compensatory capabilities of the NS.
Phylogenetically, the oral ganglion of the worm developed into the olfactory brain, which was later supplemented by the visual brain and limbic cortex to organize behavioral reactions. With increasing complexity of afferent impulses, the thalamic system is organized. As movements become more complex, a subcortical extrapyramidal system is formed. The last to form is the bark. In parallel with the emergence of new structures, the organization of the system also becomes more complex. To ensure all the variety of connections, their flexibility and constancy, the system must have energy and information supply. An additional, undifferentiated system is organized - the reticular formation. Consequently, the main functional structures that determine brain activity are the cortex, subcortical regions and the reticular formation.
The correct phase interaction of systems at rest and during physiological changes comes to the fore in the formation of the basic pattern of electrical activity. Let us examine the principle of connections between the cortex, subcortex and trunk. In order for the cerebral cortex to analyze something and make decisions, it must receive information. According to P.K. Anokhin, a complex self-regulating system functions through circular connections with an active feedback response: information -> processing -> action -> information; the circle closes. If we take the normal organized EEG pattern, we see the alpha rhythm in the form of spindles in the posterior regions (and its motor counterpart, the mu rhythm in the central regions) and the predominance of slower rhythms in the frontal regions. All this is superimposed on the fast rhythms of the cortex.
The relationship of rhythms, regardless of amplitude values, is mathematically assessed by coherence, cross-correlation and phasicity. According to the wave theory (Grindel O. M. et al.), built on the basis of analysis of a large amount of data, all EEGs were divided into two large types according to the nature of the connections: wave and impulse (20%). The wave type, being more common, determines the balance and constancy of cyclic processes, which is consistent with the principle of active feedback (according to P.K. Anokhin). Coherence is maximum in the frontal regions across all wavelength ranges and minimal in the occipital regions. Considering that coherence determines the degree of connection, we can assume that in the occipital regions a large number of separate sources are formed, and in the frontal regions they are united by a single organizing force. Let's try to explain the processes as follows.
Afferent impulses arrive at the thalamus, where they are switched and, after certain processing, move to the cortex (generally accepted idea). According to the theory of dynamic localization of functions in the cortex (Pavlov I.P.), impulses functionally arrive in different sections, which leads to the emergence of many centers for processing heterogeneous information. The combination of centers gives a combination of impulses that manifests itself in the back of the head (not surprising since the bulk of the information comes to the visual centers, in addition, heterogeneous information from other affectors comes to the temporo-occipital regions) (Krol B. M.). This information is quite non-specific in a state of quiet wakefulness. The sendings are pulsed, which is consistent with the trigger function of the thalamus (other sendings will not lead to the formation of centers, taking into account the functional refractoriness of the latter). Impulsivity is expressed in the modulation of the alpha rhythm in the occipital regions and the phase mismatch of the spindle envelope in different leads (visible by eye when assessing the curve). Similar processes occur in the central sections, where the afferent and efferent (motor) analyzers meet. Thanks to this connection, the degree of process mismatch is less. Next comes the complex process of perception and analysis of irritation “on the spot.” In the frontal regions, all information is integrated and a single action is formed. This leads to the emergence of a single center in the frontal regions, but one with a slower wave function. Next, the information goes to the subcortical structures and is implemented by the system in the form of voluntary reactions. The wave circle of information closes and a new one begins, which also determines the degree of modulation.
The EEG pattern changes during functional tests. During functional tests, there is an increase in the activity of certain structures. The following loads are used: eye opening, flash of light, hyperventilation, photostimulation, phonostimulation.
Test "Opening the eyes" . When the eyes are opened on the EEG, the alpha rhythm disappears and is replaced by fast rhythms (activation reaction). At the same time, the speed of onset of the reaction, the degree of inhibition of the alpha rhythm, and the persistence of activation are assessed (according to our data, it is noted that on average the reaction lasts 20 - 25 s, then elements of the alpha rhythm appear). After closing the eyes, normally, a recoil reaction occurs, which manifests itself in a temporary increase in the basic rhythm. At the same time, the latency of restoration of the basic rhythm, the degree and persistence of the recoil reaction are assessed. With this test, the reactivity of the cortex, the persistence of excitation processes in the cortex, and the severity of subcortical tone are assessed. This test is more physiological than the activation reaction to a flash of light and carries more information. (But the reaction to a flash of light can be used when examining comatose patients). The processes occurring during the activation reaction can be functionally represented as follows. Opening the eyes significantly increases the flow of impulses into the cortical regions, which leads to increased differentiation of the cortex. This manifests itself on the EEG as an activation reaction with desynchronization (external desynchronization) due to fast rhythms. Mathematically, the coherence gradient increases, but in general the coherence remains at the basic level because physiological activation does not disrupt the connection system.
Hyperventilation test . During the test, the patient breathes heavily, focusing more on exhalation. Hyperventilation is carried out for 3 minutes. During examination, during special examinations, 5-minute hyperventilation is performed. On the EEG, during the test, an increase in the alpha rhythm occurs with its slight slowdown and redistribution to the anterior sections. The degree of modulation decreases. Physiologically, hyperventilation reduces the partial pressure of CO2 in the blood. This leads to the activation of nonspecific subcortical structures and increases the flow of nonspecific, synchronizing impulses into the cortex. When the subcortical parts are overexcited, island-wave activity occurs on the EEG (normally occurs with hyperventilation for more than five minutes).
Photostimulation .
It is carried out in two versions: rhythmic and trigger. With rhythmic photostimulation, flashes of light are given rhythmically at a certain frequency. Various frequency ranges are used. With rhythmic stimulation, a reaction of rhythm assimilation occurs. A rhythm appears on the EEG that matches the frequency of the stimulation rhythm. With spectral analysis, it is possible to identify not only the assimilation of rhythm by the main harmonic (stimulation frequency), but also subharmonics, as a rule, by frequencies even to the main stimulation frequency. Normally, rhythm changes in people are expressed to varying degrees. But more often medium and fast rhythms are acquired, without pronounced asymmetry, mainly in the posterior or central sections. Based on the degree of rhythm assimilation, compliance with the frequency of harmonics, and symmetry, one can assess the degree of trigger function of the thalamus and the mobility of processes in the cortex. Trigger stimulation is carried out by delivering light stimulation at the frequency of the main EEG rhythm. For this purpose, special synchronizing devices are used.
Types of research
Curves of changes in brain biopotentials reflect neurodynamic changes that develop under the influence of a pathological process in the brain. For different diseases, curves of the same shape can be recorded. At the same time, the same lesion can cause different bioelectrical disturbances. Their nature and severity depend on the functional state of the formations under study.
By deciphering the electroencephalogram, neurophysiologists obtain a description of functional changes in the brain, and not an answer to the question about the cause of the disease. EEG changes in brain lesions can be divided into 2 groups. The first group is characterized by changes in EEG components:
- Alpha wave frequency and shape;
- Their distribution along the convexital cortex (adjacent to the inner surface of the skull bones);
- Disappearance or excessive synchronization of alpha activity;
- Changes in beta activity.
The second group of changes includes the appearance of theta, delta and acute waves, complexes of slow and acute waves. These changes may be permanent or paroxysmal in nature. Neurophysiologists distinguish 6 types of frequency-amplitude indicators:
- Normal EEG with a predominance of alpha waves with an amplitude in the range of 25-55 μV, a moderate number of beta waves, slow waves with an amplitude of 15-20 μV are 5-10 times less common than alpha waves;
- Hypersynchronous EEG of different variants (with an increased number of alpha waves compared to beta and theta oscillations, only low-frequency beta rhythm in all areas of the brain, alpha-like theta waves in all areas of the brain);
- Desynchronous EEG (a drop in the number of alpha waves and a decrease in their amplitude, a 3-15 times increase in the number of beta waves, a slight increase in the number of slow waves;
- Irregular, disorganized EEG - the alpha rhythm is not expressed, single alpha waves are recorded, the number of beta waves is reduced, the number of slow waves is slightly increased; the amplitude of oscillations of all frequencies is in the range of 25–40 μV;
- Grossly disorganized EEG with a predominance of high-amplitude slow waves, the appearance of sharp waves, paroxysmal discharges, complexes of sharp and slow waves;
- Locally disturbed EEG (with the presence of focal or unihemispheric shifts in the EEG).
EEG helps neurologists and neurophysiologists determine the severity of the process, its localization and prevalence, the development of cerebral symptoms, reflex changes, and damage to deep brain structures.
Additional EEG Analysis Methods
Currently, visual analysis remains the main method of EEG analysis. Additional analysis methods include calculating the power spectrum using the fast Fourier transform. The power spectrum shows the severity of the rhythm of a given frequency. The power spectrum is visually presented in the form of averaged curves, distribution of power spectra by epoch, and spectral mapping.
Another additional method is coherence calculation. Coherence shows the degree of similarity of oscillatory processes at two different points, regardless of their amplitude representation. It has been established that the average coherence value is constant and reflects the degree of stability of connections in the system.
Recently, another processing method has been used. This is the localization of sources of pathological activity using the Multi-step Dipole Localization method. Through numerous calculations, a mathematical model of the probable location of the source of a given wave is created. This model is compared with the amplitude distribution of the same waves on the scalp. For localization, only those EEG slices are used that have a given probability of convergence between the computational model and the scalp recording. A probability of 0.95 or more is considered reliable.
Night EEG monitoring
Nighttime EEG sleep monitoring is one of the most revealing diagnostic methods for studying the functional activity of the brain. It allows for differential diagnosis of epilepsy with non-epileptic seizure syndrome. Recording an EEG during one minute of sleep can provide more information about the epileptic process than a full hour of daytime video EEG monitoring.
At the Yusupov Hospital, the procedure is performed by neurophysiologists and functional diagnostic doctors, candidates of medical sciences. To conduct night EEG, modern equipment from leading global manufacturers is used. Patients are examined in a specially equipped comfortable room. During the procedure, one of the relatives may be in the room. The clinic accepts patients aged 18+.
In cases of mental development disorders in children, changes in the usual EEG are often not detected. Children with hyperactivity and autistic disorders, frequent awakenings at night, otherwise unexplained, and behavioral disturbances sometimes have epileptiform EEG activity during sleep. They are recorded using an overnight pediatric EEG. Delayed psycho-speech development, bedwetting, sleepwalking and sleep-talking phenomena, and stuttering can be the cause of long-term paroxysmal activity during sleep.
Neurophysiologists perform EEG sleep monitoring in the presence of the following indications:
- Episodes of sleepwalking or sleep talking;
- Frequent awakenings during sleep;
- Excessive physical activity;
- Epilepsy with daytime seizures;
- Epilepsy with seizures during sleep;
- Neurosis-like disorders and urinary incontinence.
The procedure is indicated if the child has autism, stuttering, delayed mental or speech development, or speech dysfunction of an unspecified nature.